
How Much Rain Fell Across Nepal During the 2026 Monsoon?
Published:
Introduction
How much rain fell across Nepal during the 2026 monsoon?
A single national rainfall total cannot show how rainfall was distributed across a country with such strong differences in elevation and terrain. To look at the season from a spatial perspective, I used the GPM IMERG V07 precipitation dataset to map rainfall accumulation across Nepal from 1 June to 30 September 2026.
This analysis is not intended to replace Nepal’s rain-gauge observations. Instead, it provides a continuous rainfall field that makes it possible to look at three related questions:
Where did rainfall accumulate? How did the seasonal total evolve? And how unevenly was rainfall distributed across Nepal?
The final IMERG estimate gives a June–September rainfall accumulation of 1,006.0 mm across the Nepal analysis boundary. This was 208.2 mm, or 17.1%, below the 2000–2025 IMERG climatological accumulation for the same period.
At the same time, September was the largest monthly contribution to the season, adding 295.2 mm, or 29.3% of the total.
1. Where did rainfall accumulate?
The maps below show how cumulative rainfall built up during the monsoon. Rather than looking only at the final September total, the four panels show the progression from June through September.
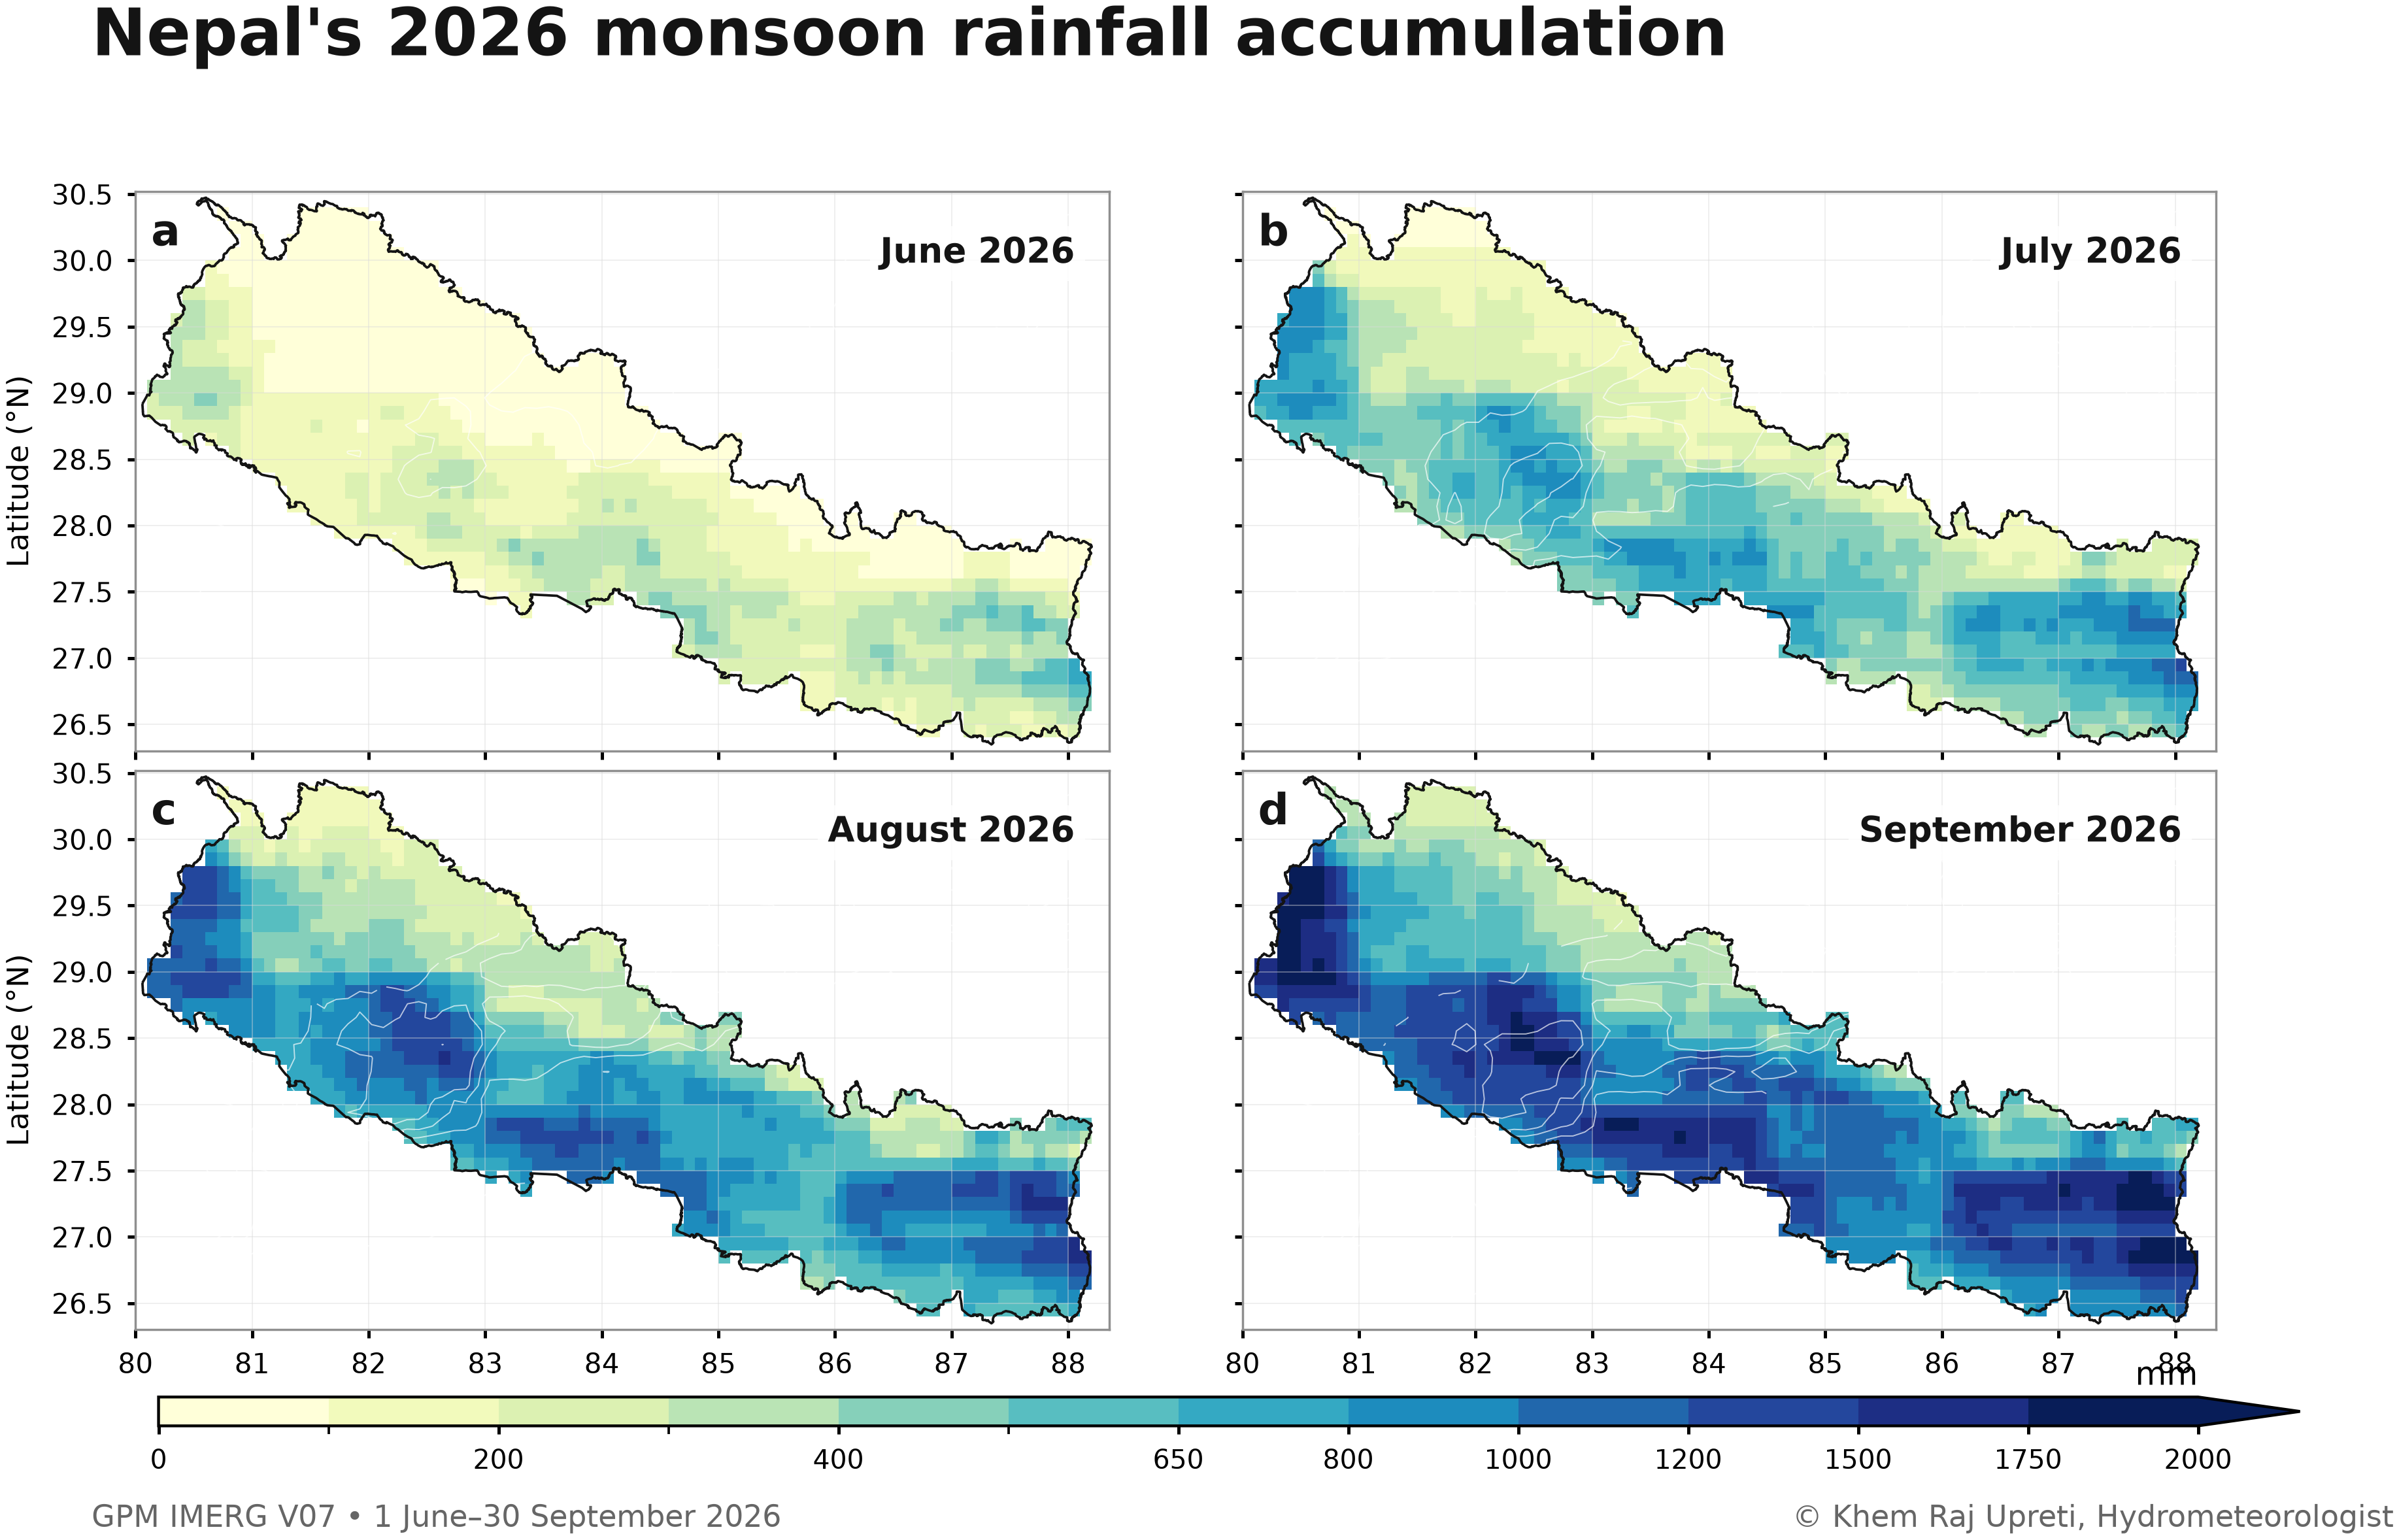
Figure 1. Cumulative GPM IMERG V07 precipitation across Nepal at the end of June, July, August, and September 2026. Analysis period: 1 June–30 September 2026.
By the end of September, the spatially averaged cumulative rainfall was 1,006.0 mm, equivalent to about 100.6 cm of rainfall depth.
The map is useful because the national mean is only one number. The spatial field shows that rainfall accumulation was not uniform across the country.
2. How did the season compare with the recent IMERG climatology?
The seasonal total was below the corresponding 2000–2025 IMERG climatology.
By 30 September, the 2026 accumulation was:
- 2026: 1,006.0 mm
- 2000–2025 climatology: about 1,214.2 mm
- Departure: −208.2 mm
- Anomaly: −17.1%
The cumulative time series shows how the difference developed during the season.
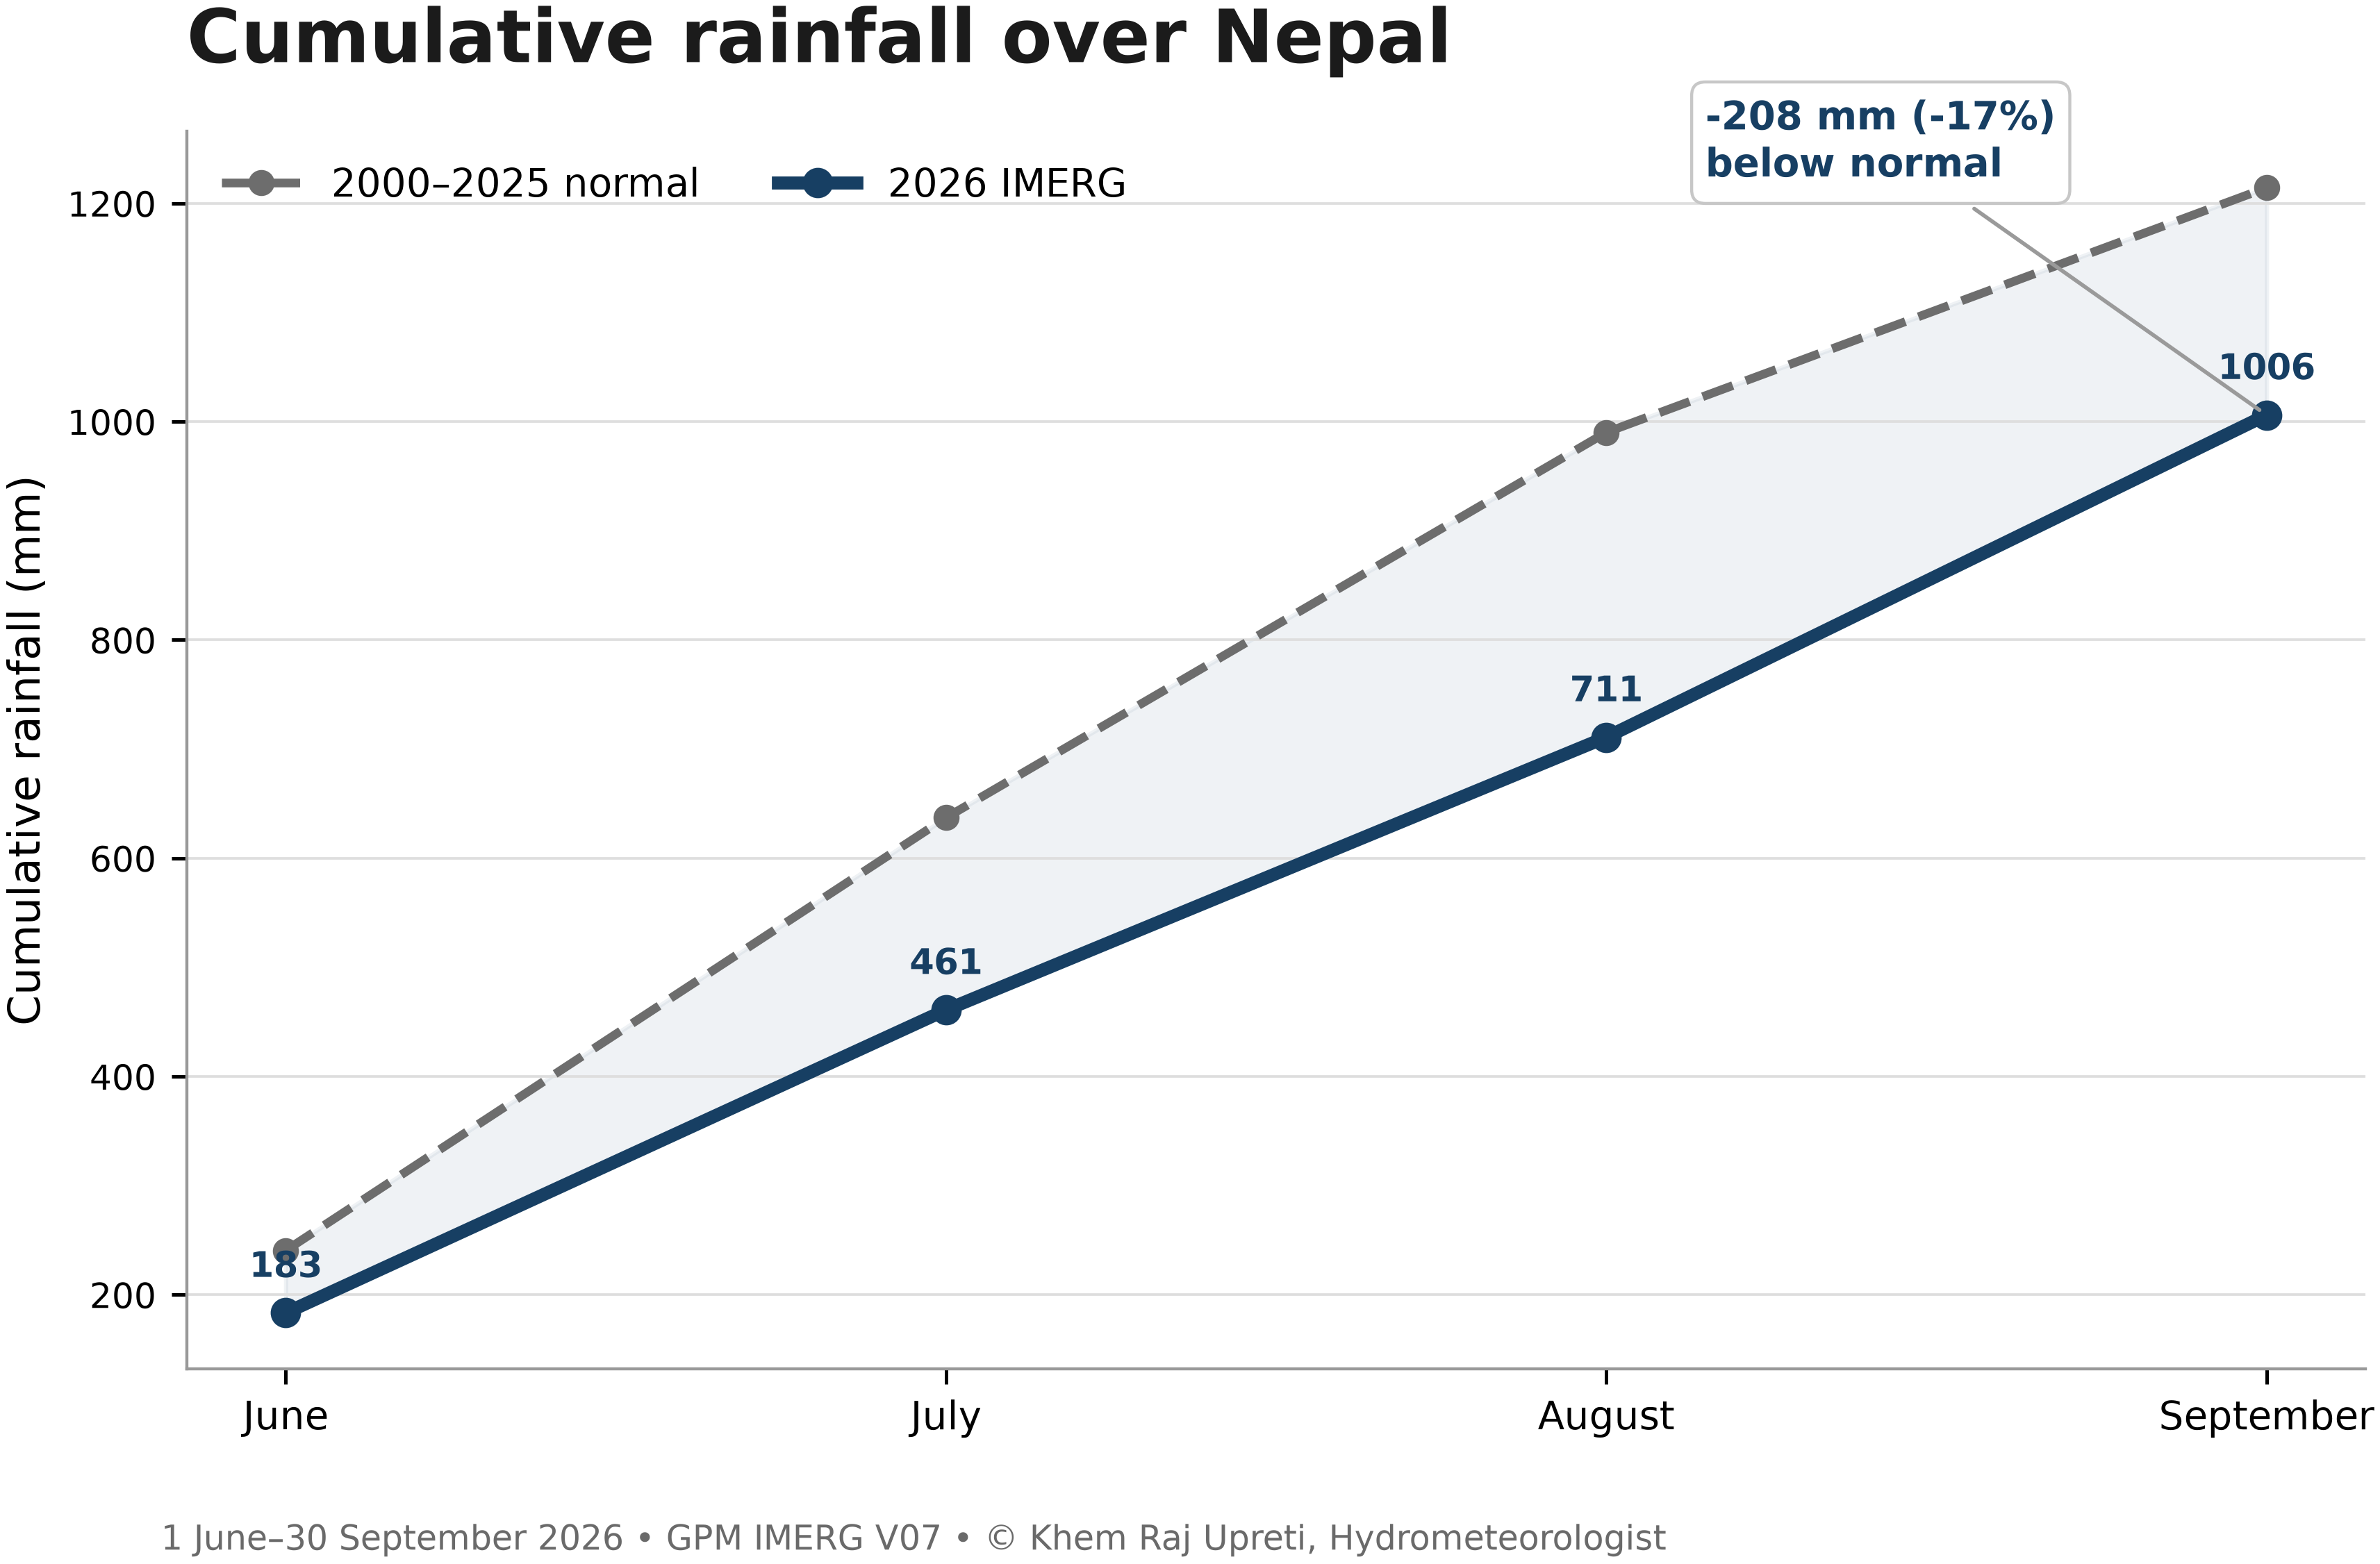
Figure 2. Cumulative 2026 IMERG precipitation compared with the 2000–2025 IMERG climatological accumulation for the same period.
The gap between 2026 and the climatology was widest around the end of August. Rainfall during September narrowed part of that shortfall, but the season still ended below the reference climatology.
3. September supplied the largest share of the seasonal rainfall
The four months did not contribute equally to the final total.
| Month | Rainfall added | Share of seasonal total |
|---|---|---|
| June | 183.4 mm | 18.2% |
| July | 277.6 mm | 27.6% |
| August | 249.8 mm | 24.8% |
| September | 295.2 mm | 29.3% |
September contributed the largest amount, accounting for nearly one-third of the June–September accumulation.
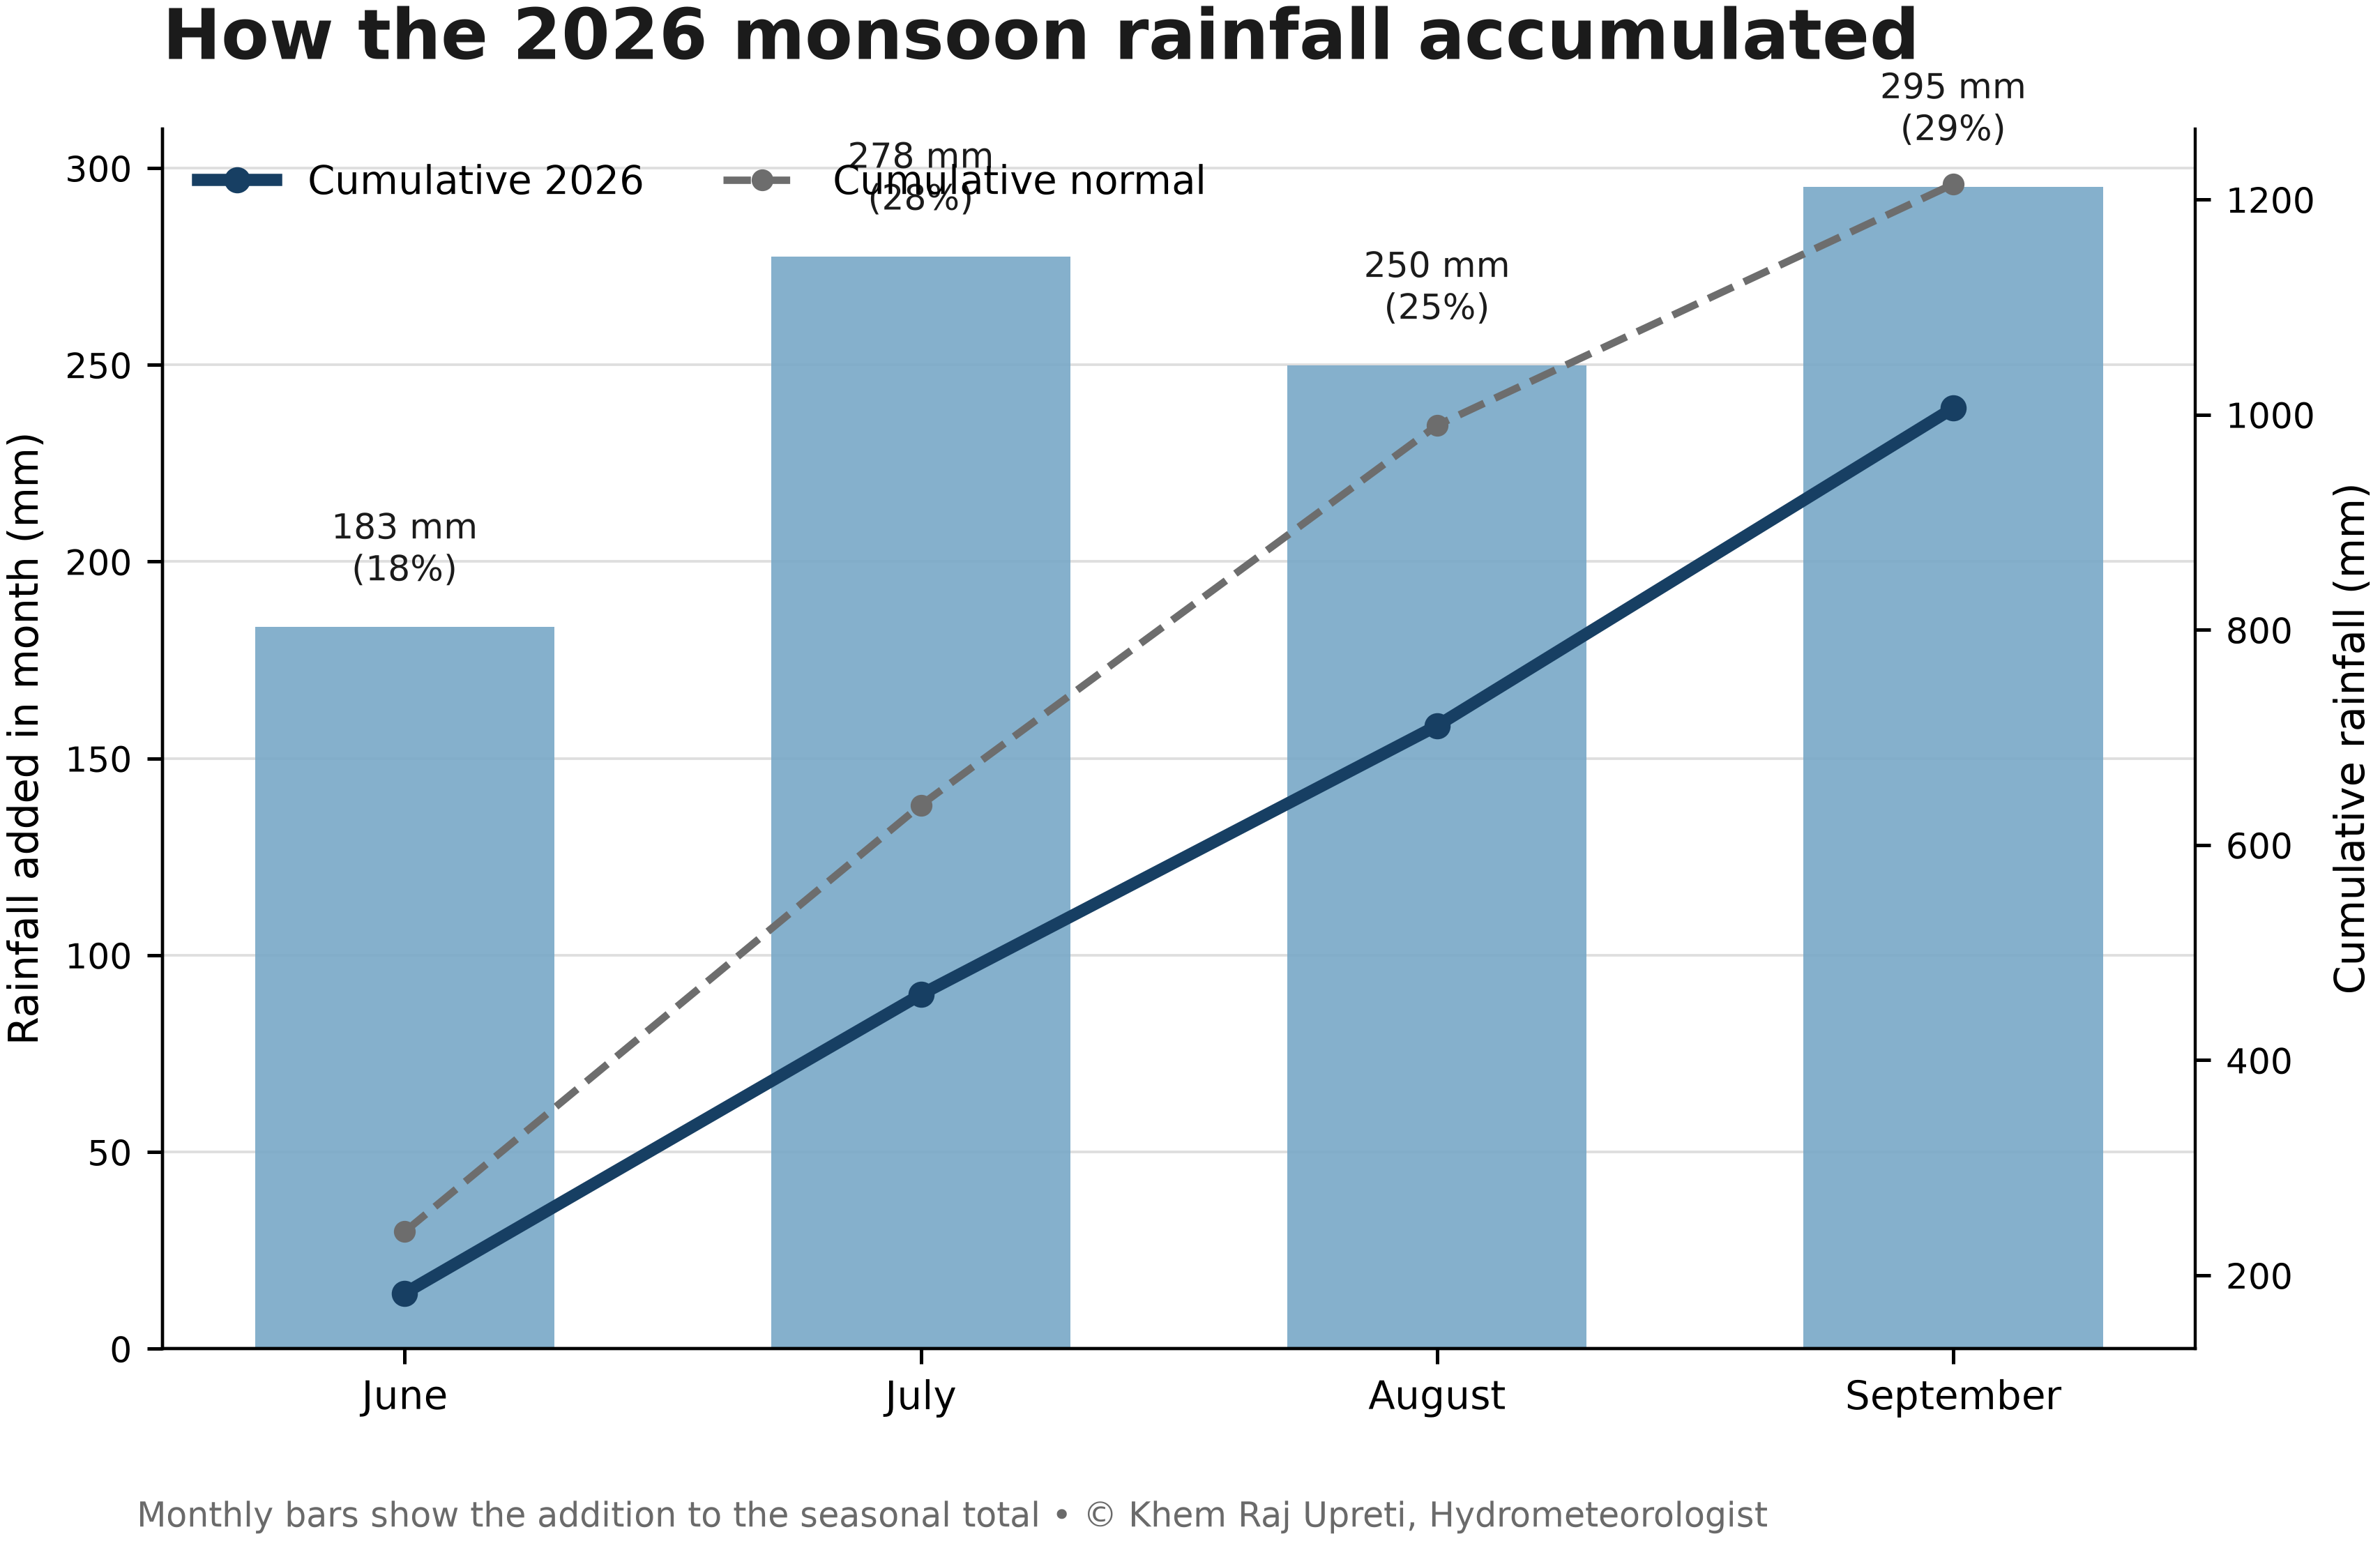
Figure 3. Monthly contributions to Nepal’s cumulative IMERG rainfall during June–September 2026.
This late-season contribution is one of the clearest features of the 2026 rainfall budget. A season can finish below its longer-term accumulation while still receiving a substantial share of its rainfall late in the monsoon.
4. The national deficit was not the same everywhere
A national anomaly of −17.1% does not mean that every part of Nepal received 17% less rainfall.
The anomaly maps show how the cumulative departure from the 2000–2025 reference changed across the country during the season.
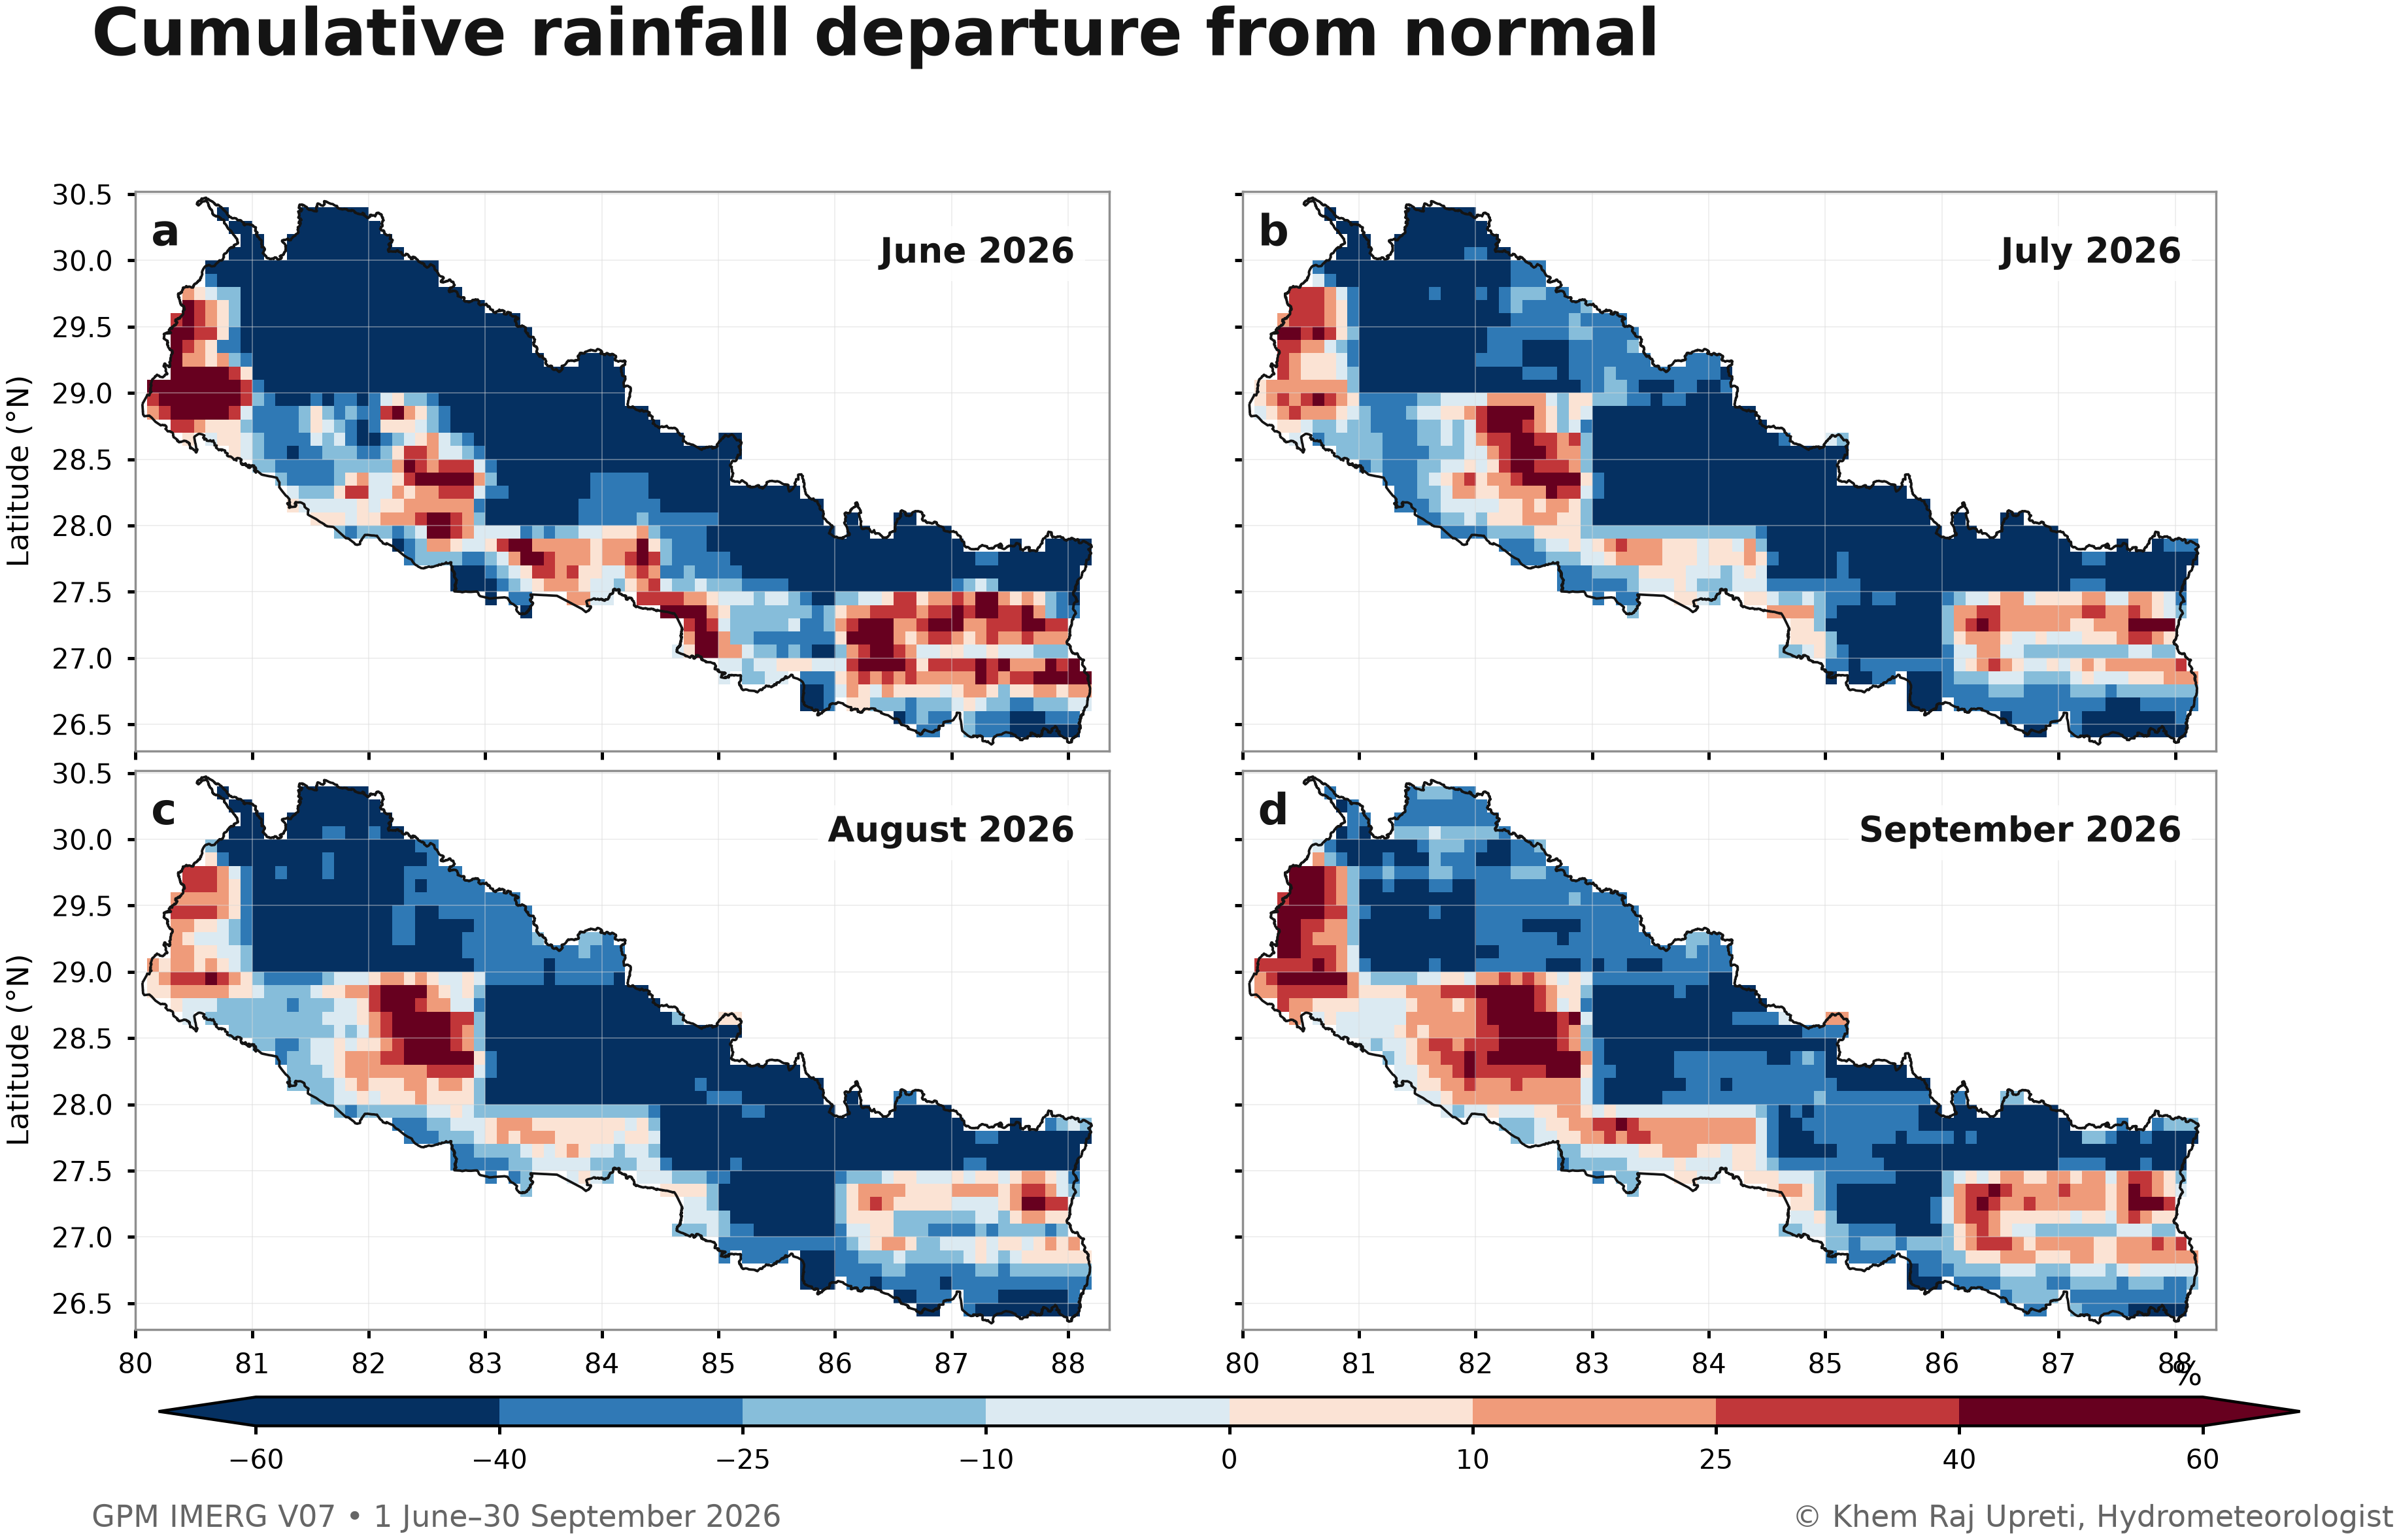
Figure 4. Cumulative departure of 2026 GPM IMERG precipitation from the 2000–2025 IMERG climatological accumulation at monthly checkpoints.
The value of a spatial rainfall field is that it keeps this geographic variation visible. The country-wide number provides the summary; the maps show where that summary came from.
5. Rainfall was moderately uneven across the country
Another way to describe the season is to ask how rainfall was distributed across the country’s area.
At the end of September, the wettest 10% of the analysis area accounted for 17.8% of the total rainfall. The wettest 25% accounted for 39.8%, while the wettest half accounted for 68.9%.
The rainfall concentration Gini index was 0.258.
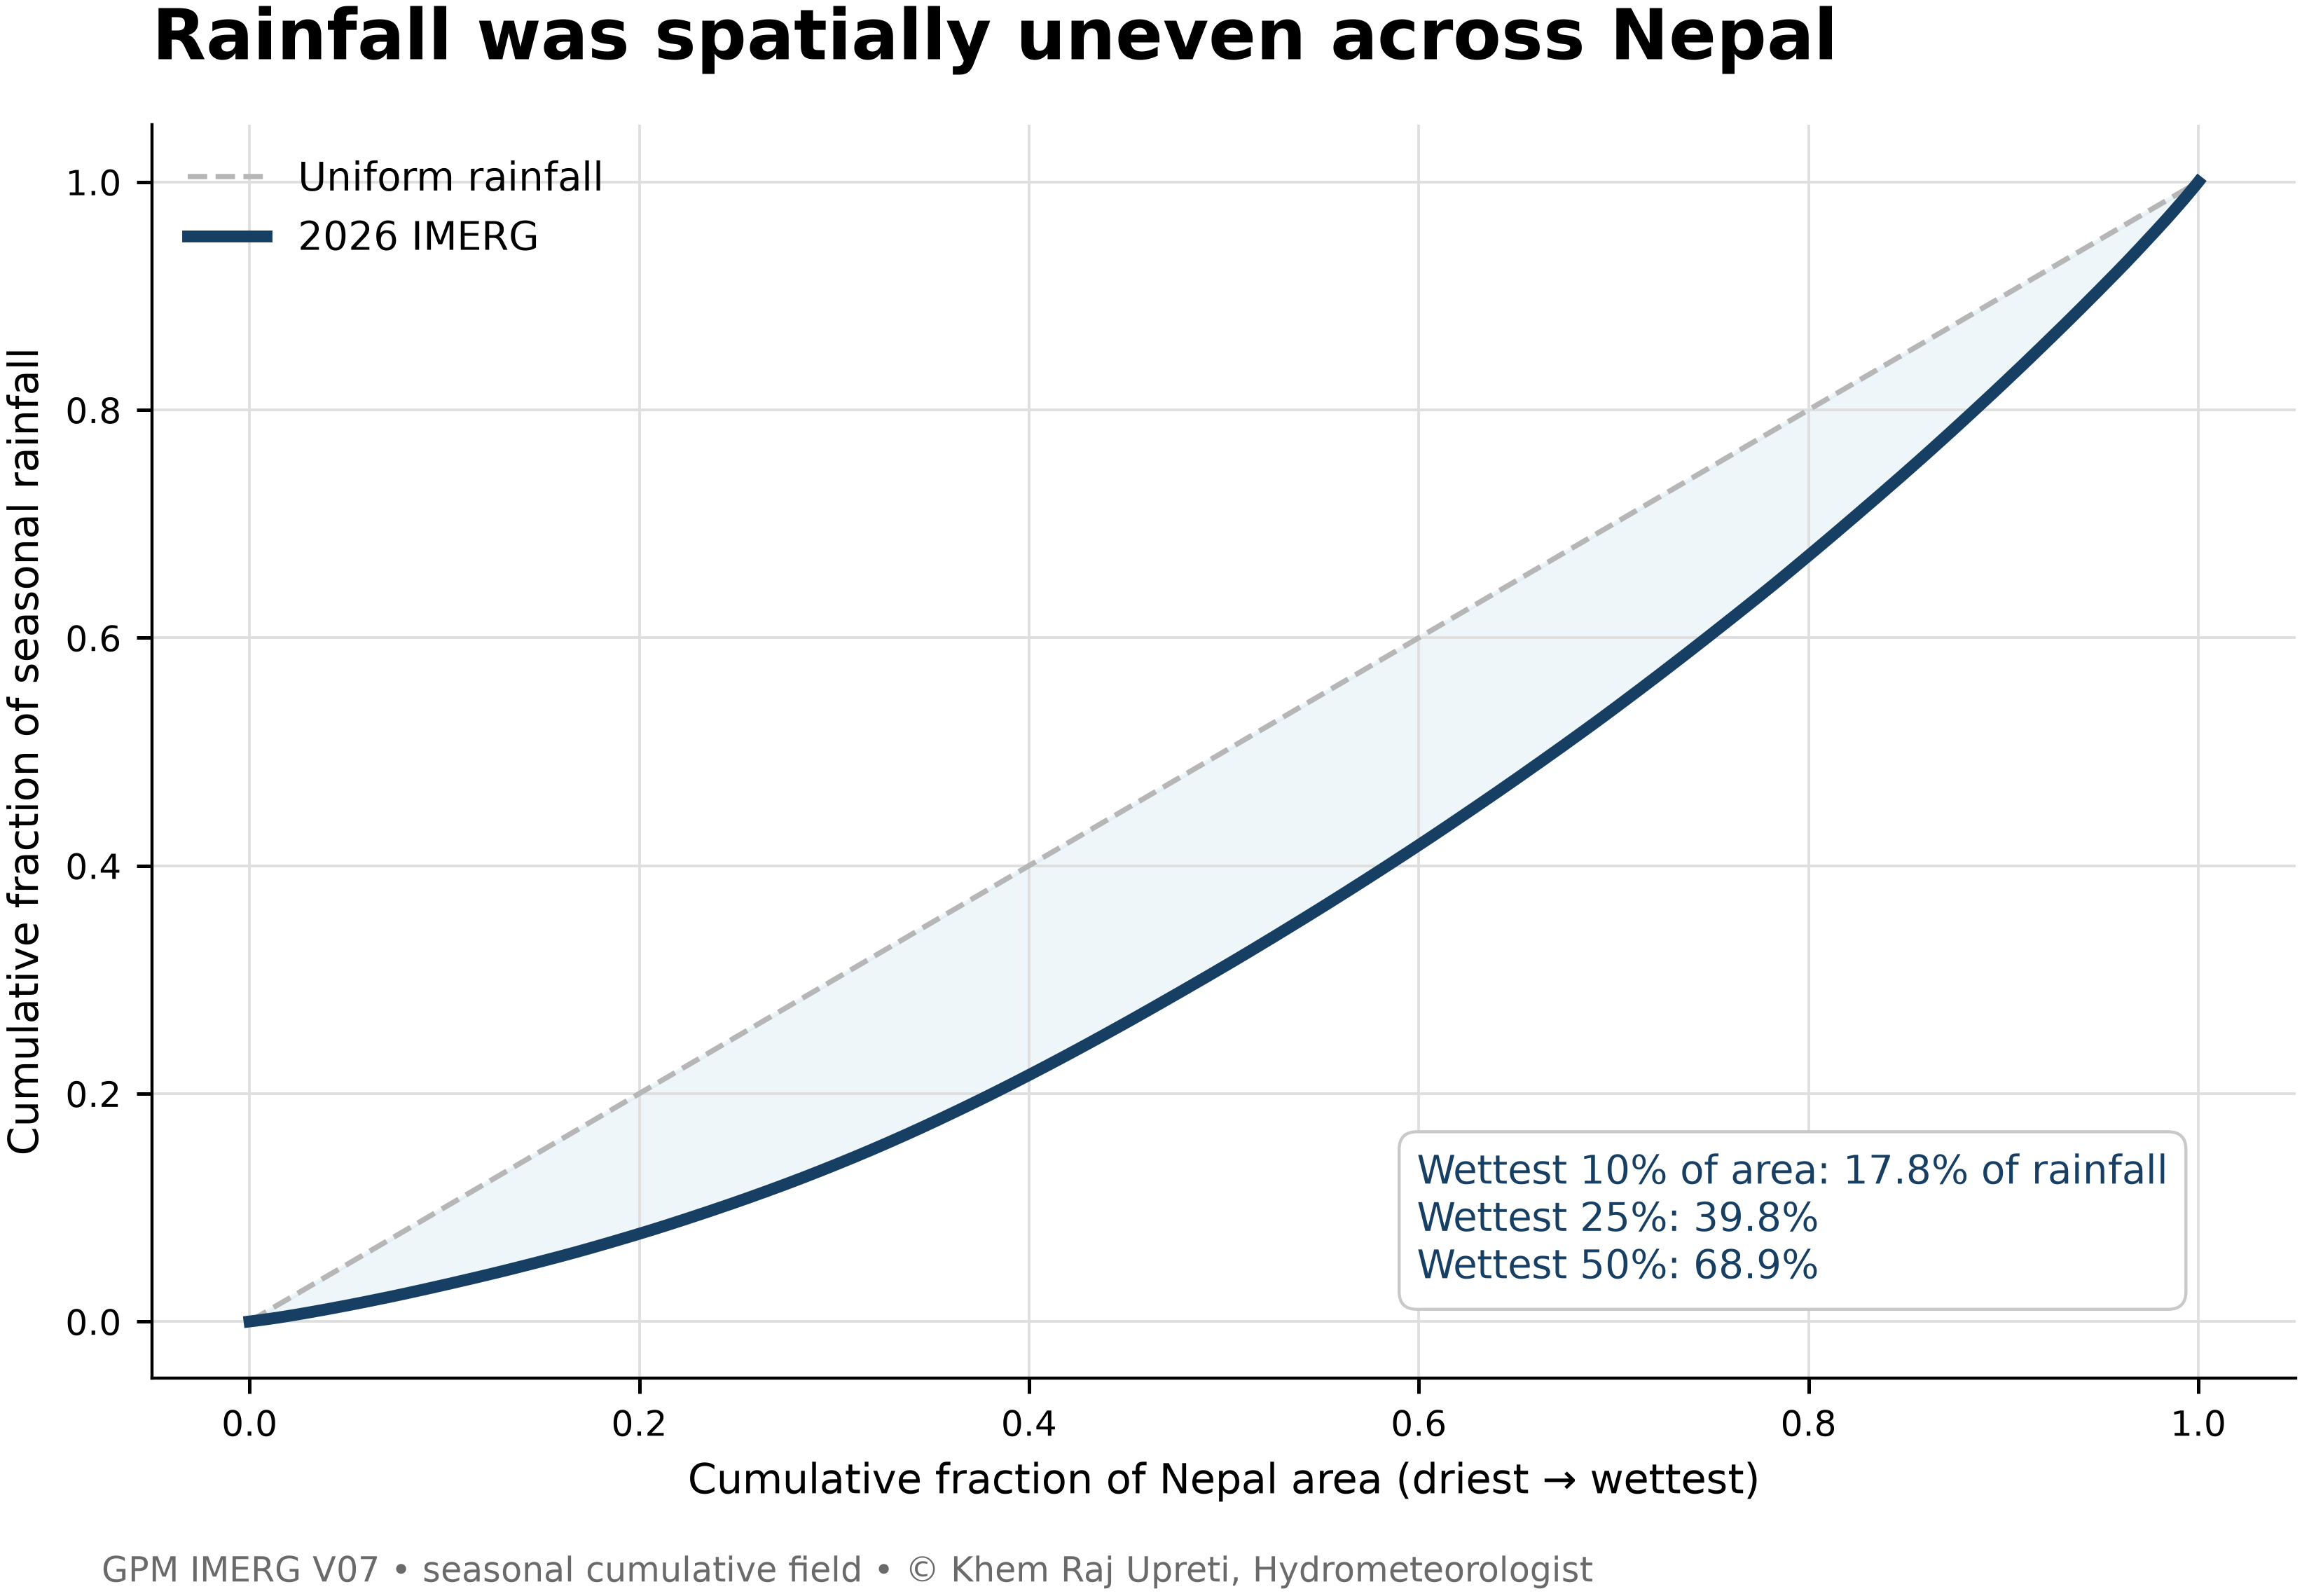
Figure 5. Spatial concentration of June–September 2026 rainfall. Grid cells are ranked from lower to higher rainfall, and the curve shows the share of total rainfall contributed by progressively wetter portions of the analysis area.
These values indicate that rainfall was not evenly distributed across the country. A relatively wetter part of the analysis area contributed a larger share of the seasonal total.
6. Looking at rainfall as a volume
The final cumulative rainfall corresponds to an integrated precipitation volume of approximately 145.23 km³, or 145.23 trillion litres, across the analysis field.
This is another way of expressing the rainfall total: rainfall depth is combined with the area represented by each grid cell and then summed across Nepal. The volume is calculated over the IMERG grid cells inside the Nepal boundary (about 144,000 km², roughly 2–3% less than the boundary polygon area), so it should be read as an approximate figure.
It should not be interpreted as the amount of water that remained on the land surface. Rainfall is continuously intercepted, infiltrated, evaporated, and routed through rivers during the season.
7. How large was the rainfall footprint?
Rainfall accumulation also expanded spatially through the season. The threshold analysis tracks the proportion of the analysis area that crossed selected cumulative rainfall levels as the monsoon progressed.
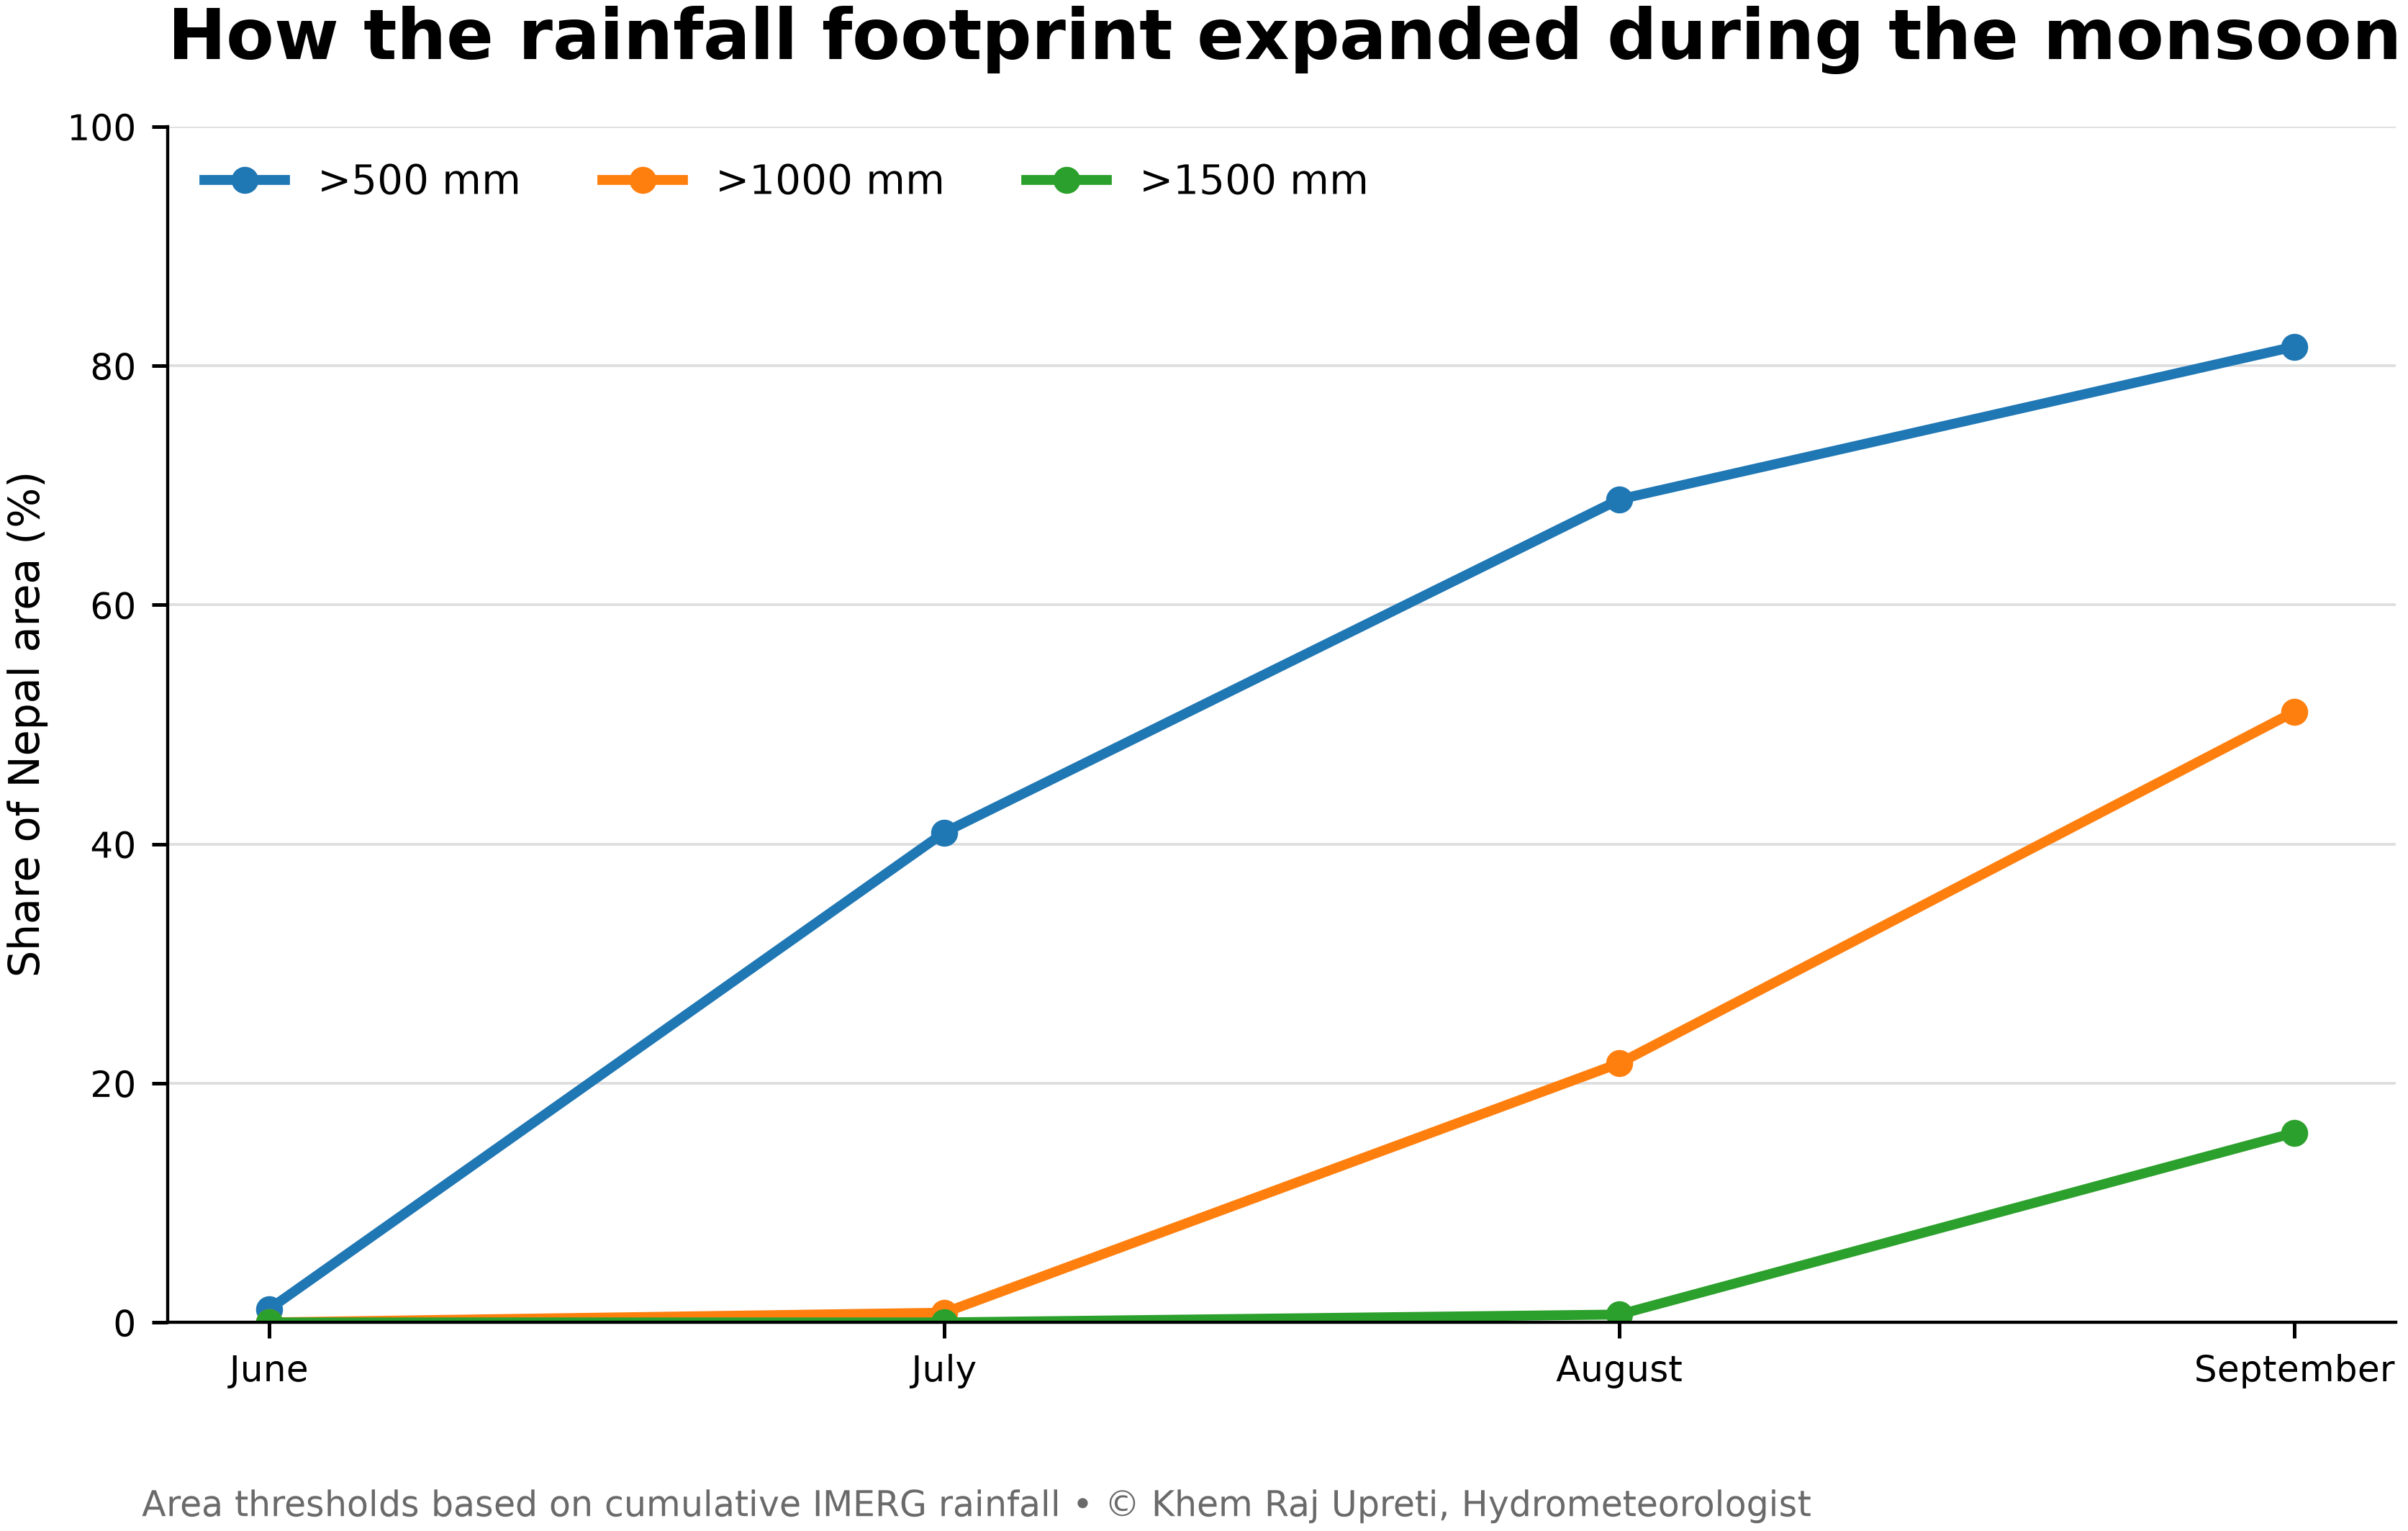
Figure 6. Expansion of the cumulative rainfall footprint across Nepal during the 2026 monsoon. Lines show the share of the analysis area exceeding selected cumulative rainfall thresholds.
This provides a different perspective from the national mean. Instead of asking only how much rain fell on average, it asks how widely different accumulation levels spread across the country.
8. What this satellite view adds
The main value of this analysis is spatial continuity.
Rain gauges provide direct observations at specific locations. A gridded satellite product provides a continuous rainfall field that can be examined between observation points. This makes it possible to study the spatial structure of seasonal rainfall, compare accumulation with a gridded reference period, and quantify how rainfall was distributed across the country.
For hydrology and disaster-risk applications, this distinction matters. Seasonal rainfall accumulation does not directly determine flood magnitude. Flood response also depends on rainfall intensity and duration, antecedent conditions, terrain, land cover, runoff generation, river conditions, and drainage.
This analysis therefore describes rainfall accumulation and distribution, not flood severity.
Data and what to keep in mind
This analysis uses GPM IMERG V07, a satellite-based rainfall dataset with precipitation estimates at about 11 km spatial resolution and 30-minute intervals.
Rainfall estimates were accumulated from 1 June to 30 September 2026 and compared with an IMERG climatology for 2000–2025 over the same seasonal period.
The maps use the Nepal boundary used in the analysis, and national statistics are calculated from the spatial rainfall field.
IMERG is a satellite estimate, not a direct rain-gauge measurement. The values reported here represent the IMERG data available when the analysis was completed on 2 October 2026. Satellite precipitation estimates can be revised as later processing becomes available, so these results should be treated as a current-season satellite estimate rather than a permanent final observational record. IMERG also tends to underestimate orographic rainfall in mountainous terrain.
A fixed 1 June–30 September window was used, not the actual monsoon onset and withdrawal dates of each year.
The values reported here represent the IMERG data available when the analysis was completed on 2 October 2026. Satellite precipitation estimates can be revised as later processing becomes available, so these results should be treated as a current-season satellite estimate rather than a permanent final observational record.
Key findings
From 1 June to 30 September 2026, the final IMERG analysis gives:
1,006.0 mm
Cumulative rainfall
100.6 cm
Equivalent rainfall depth
145.23 km³
Integrated precipitation volume
−208.2 mm (−17.1%)
Departure from the 2000–2025 IMERG climatology
295.2 mm (29.3%)
September contribution to the seasonal total
17.8% / 39.8% / 68.9%
Rainfall shares contributed by the wettest 10%, 25%, and 50% of the analysis area
Conclusion
The 2026 monsoon ended with a cumulative IMERG rainfall estimate of 1,006 mm across Nepal, about 17% below the 2000–2025 IMERG climatological accumulation.
But the seasonal average is only part of the story.
Rainfall was spatially uneven, the cumulative deficit changed through the season, and September contributed the largest monthly share of rainfall at 29.3%.
A spatial rainfall record therefore gives a more complete picture of the monsoon than a single national percentage. It shows not only how much rain fell, but also how rainfall accumulated and how unevenly it was distributed across Nepal.
Data source
GPM IMERG V07: NASA Global Precipitation Measurement Mission, Integrated Multi-satellitE Retrievals for GPM.
Google Earth Engine dataset: NASA/GPM_L3/IMERG_V07
© 2026 Khem Raj Upreti
Recommended citation: Upreti, K. R. (2026). “How Much Rain Fell Across Nepal During the 2026 Monsoon?” Technical Research Note.