
West Rapti Extreme Event Tracker
Live Application
🔗 Launch West Rapti Extreme Event Tracker —
Project Overview
The West Rapti Extreme Event Tracker is an interactive web application developed to monitor extreme rainfall events in the West Rapti River Basin, one of Nepal’s most flood-prone regions.
The application combines satellite precipitation products, terrain analysis, and exploratory hydrologic calculations to provide rapid insights into rainfall severity and potential flood response.
Developed using Python, Google Earth Engine, and Streamlit, this project demonstrates how freely available Earth observation datasets can be transformed into practical tools for hydrology, disaster risk reduction, and environmental education.
Application Interface
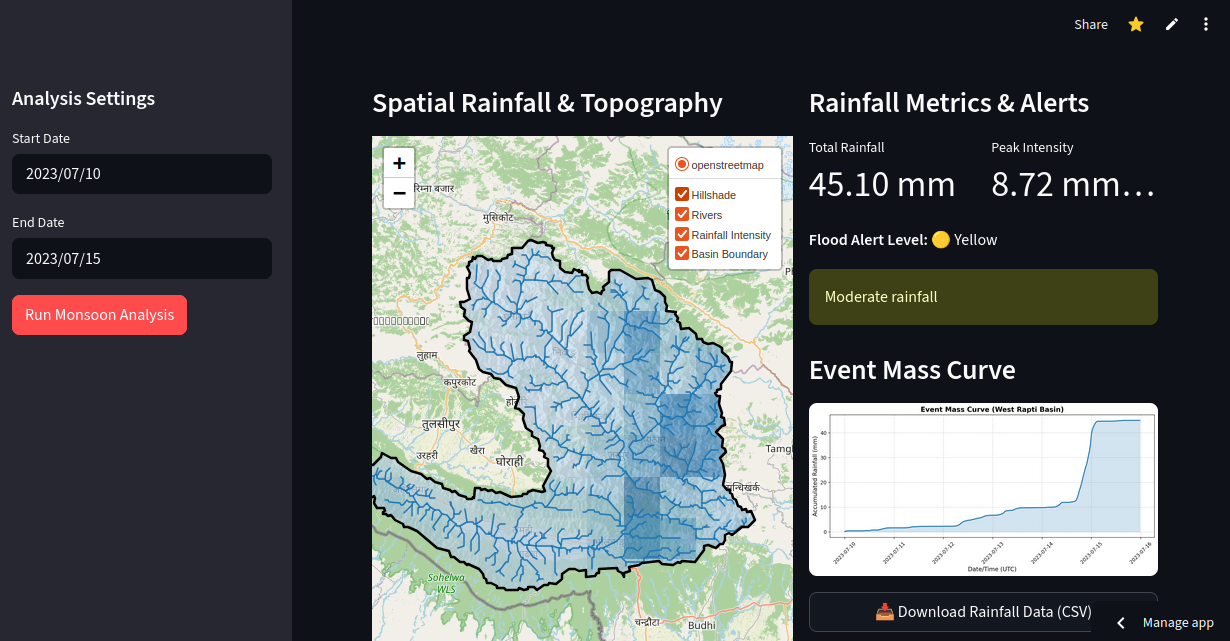
Spatial Rainfall Dashboard
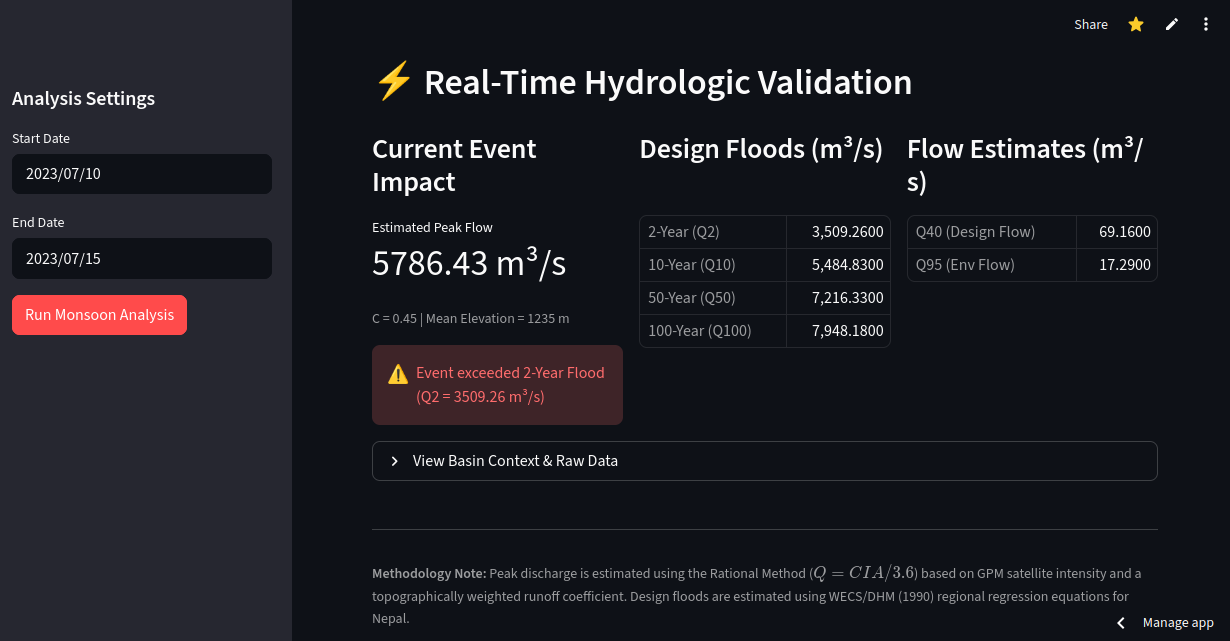
Exploratory Hydrologic Assessment
Key Features
🌧 Satellite Rainfall Monitoring
- Retrieval of NASA GPM IMERG precipitation data
- Basin-averaged rainfall time series
- Event mass curve generation
- Total rainfall and peak intensity metrics
🗺 Interactive Spatial Visualization
- Rainfall intensity maps
- SRTM hillshade background
- River network overlay
- Basin boundary display
🚨 Automated Rainfall Alerts
- Green / Yellow / Orange / Red alert classification
- Event-based rainfall severity messaging
⚡ Exploratory Hydrologic Assessment
- Peak discharge estimation using the Rational Method
- Topographically informed runoff coefficient
- Comparison with regional design flood estimates
- Flow-duration proxy metrics
📥 Data Export
- Download processed rainfall data in CSV format
Scientific Methodology
Data Sources
- NASA GPM IMERG precipitation
- SRTM Digital Elevation Model (DEM)
- HydroSHEDS river network
- Custom basin boundary GeoJSON
Hydrologic Methods
Rational Method:
Q = C I A / 3.6
Regional design flood equations based on WECS/DHM (1990)
Example Event Analysis (10–15 July 2023)
Rainfall Metrics
- Total Rainfall: 45.10 mm
- Peak Intensity: 8.72 mm/hr
- Rainfall Alert Level: Yellow (Moderate Rainfall)
Exploratory Hydrologic Results
- Estimated Peak Flow: 5,786 m³/s
- 2-Year Flood Threshold: 3,509 m³/s
This example illustrates how satellite-derived rainfall observations can be translated into indicative hydrologic metrics for rapid event assessment.
Technology Stack
- Python
- Streamlit
- Google Earth Engine
- Folium
- Pandas
- Matplotlib
Applications
This platform is designed to support:
- Extreme rainfall monitoring
- Hydrology and meteorology education
- Disaster risk reduction planning
- Research demonstrations
- Open-source geospatial learning
Future Enhancements
Planned improvements include:
- GEOGloWS streamflow forecasts
- 5-day rainfall forecasts
- Automated PDF report generation
- Multi-basin support across Nepal
- Additional export formats (PDF, GeoJSON, PNG)
Disclaimer
Hydrologic calculations presented in this application are exploratory and intended for educational and research purposes. They are not calibrated against observed streamflow records and should not be used for operational forecasting.
Author
Khem Raj Upreti
Hydrometeorologist
This project reflects my interest in integrating hydrology, meteorology, remote sensing, and open-source geospatial tools to support flood analysis and climate resilience in Nepal.